
Introduction
A nice way to summarize key information in a Dashboard is with a tile. A tile, like the example below, is a just a Form with special formatting.
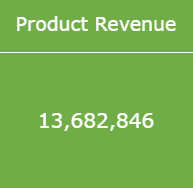
Example
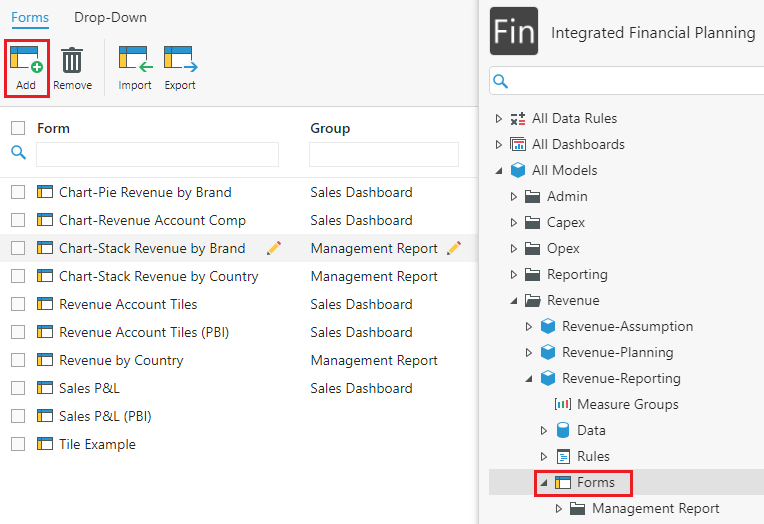
In Kepion, tiles are not unique components; they're actually Forms formatted and styled to highlight specific data. With this information in mind, let's start by creating a Form.
1. Go to the Forms node in your target Model, and select Add to create a Form.
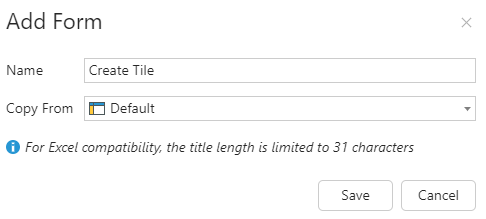
2. Name the Form and click Save.
3. Configure the Form as required.
For this example, we've created the following Form:
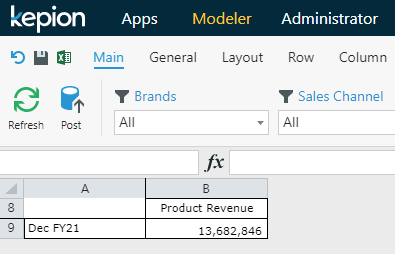
- Account on the columns (the Product Revenue member specifically)
- Months on the rows (Dec FY21 specifically)
- In addition, we’ve also added a few filters to scope the data.
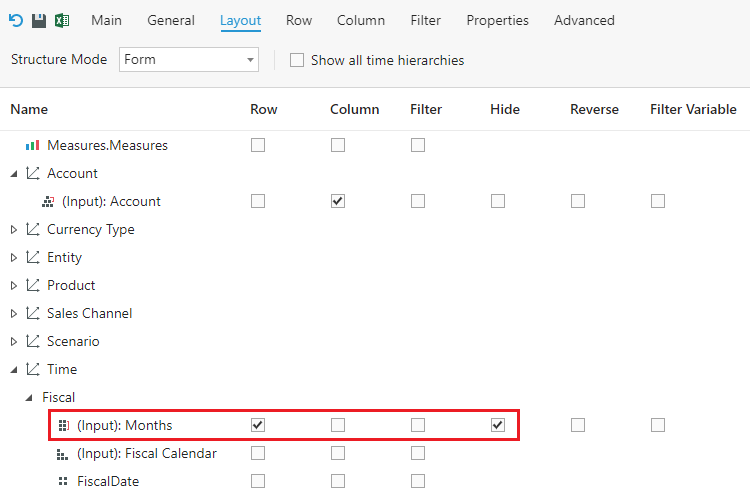
4. Go to Layout and hide the row or column Dimension(s) you don't want on the tile.
In this case, we're hiding Months.
5. Go to General and style the Form according to the target page's theme.
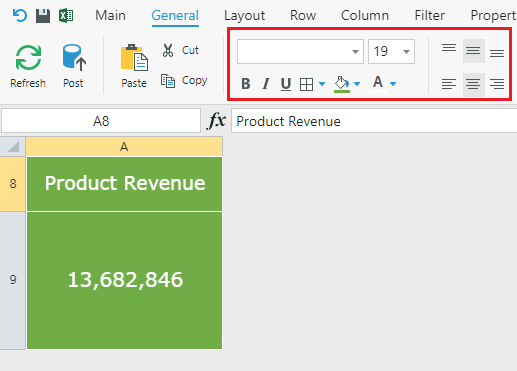
Tip: Adjust the width and height of your cells by dragging the separators.
6. Go to your target page in your Dashboard.

7. Right-click the workspace and select Add Form.
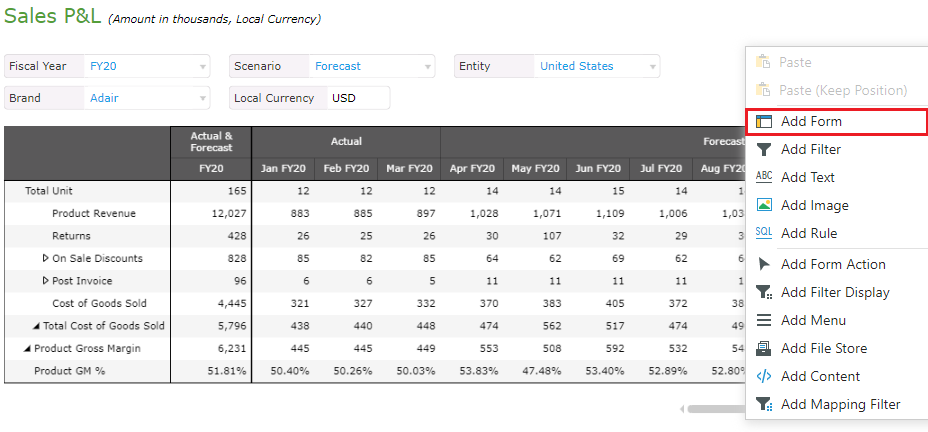
8. Select your tile from the Form drop-down.

Your tile should now appear on the Form.
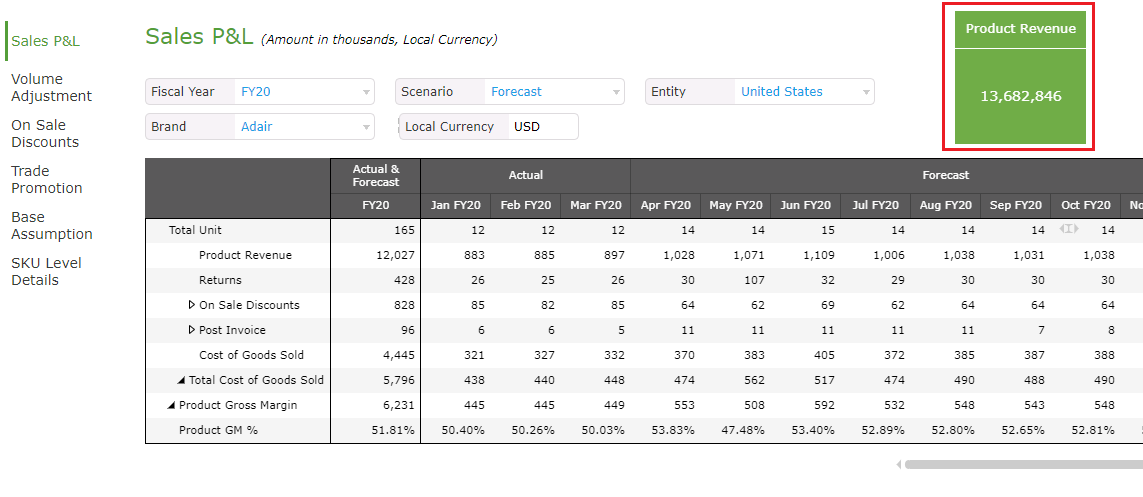
Tip: You can also re-use the same tile Form with an overridden filter to create different tiles.