Introduction
In this article, we'll explain how to use one Filter to control two charts that display the same weeks of two different years.
Example
The key is using an Application Variable. In this particular case, we need to derive week information from the Fiscal Calendar Filter selection using Application Variables, and then use the Lag function over the variable to define the time range on the X axis in the chart.
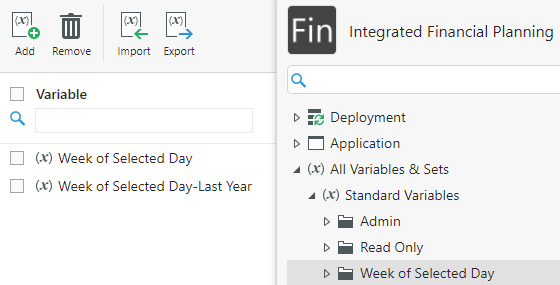
1. Go to Standard Variables and select Add.
2. Name it Week of Selected Day and define it as follows:
EXISTS([Time].[FiscalWeek].[All].Children, ${[Time].[Fiscal Calendar]}).Item(0)
3. Add another variable named Week of Selected Day-Last Year and definite it as follows:
EXISTS([Time].[FiscalWeek].[All].Children, ParallelPeriod([Time].[Fiscal Calendar].[FiscalYear], 1, ${[Time].[Fiscal Calendar]})).Item(0)
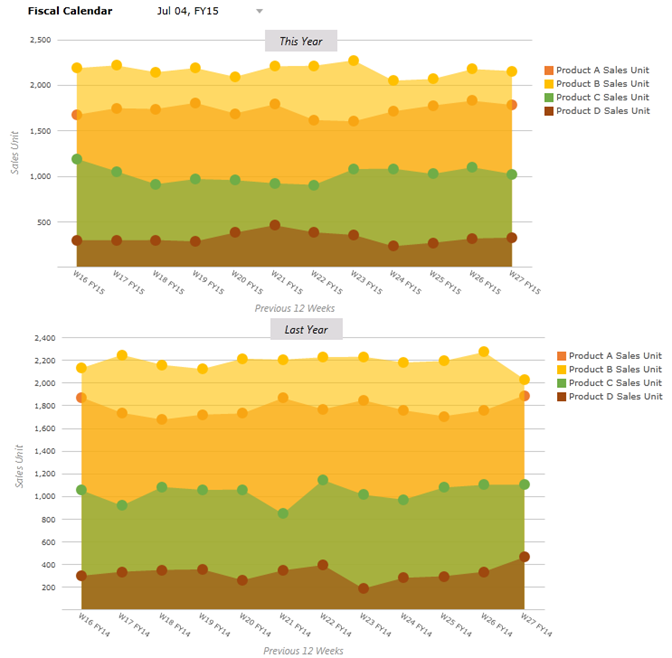
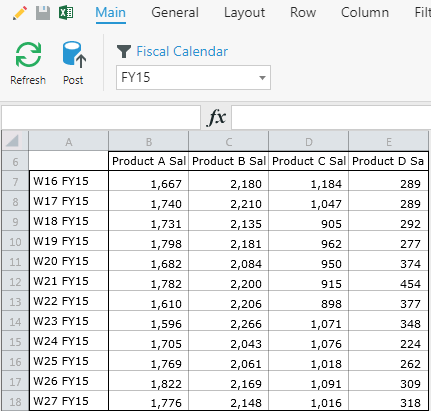
Here's the result:
4. Go to one of your target Forms (either Week of Selected Day or Week of Selected Day-Last Year) and configure the layout:
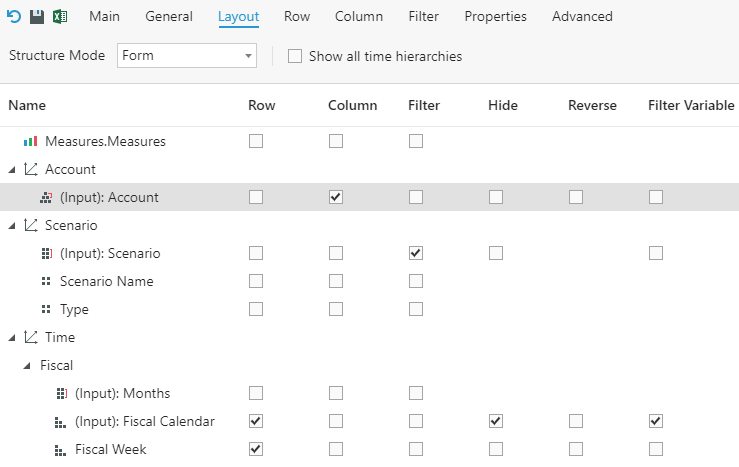
Note: Both Forms share the same layout and axes definitions.
5. Go to Row and double-click All for the Fiscal Calendar.
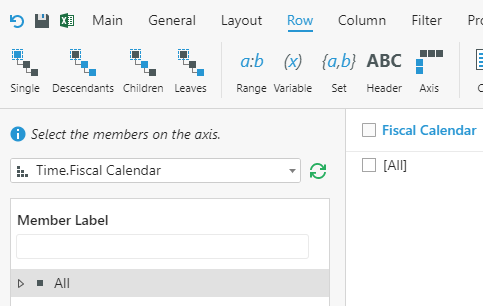
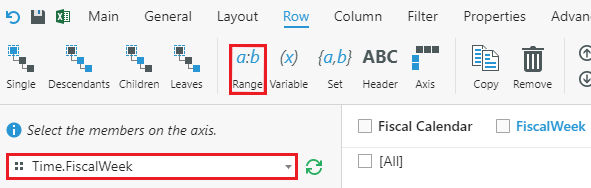
6. Select Time.Fiscal Week from the drop-down and select Range from the ribbon.
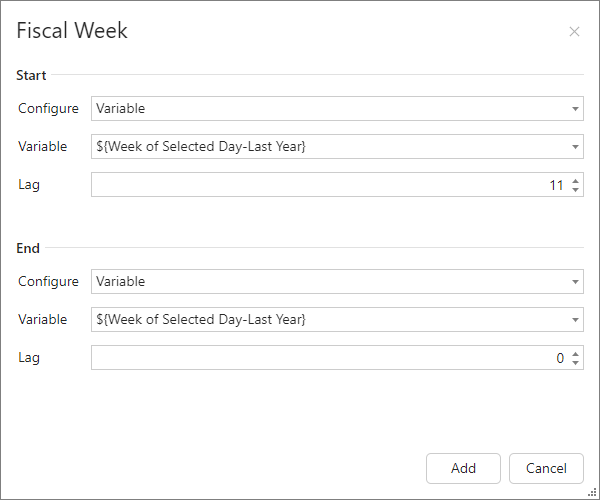
7. Since the chart displays the past 12 weeks, we can set up the range picker as shown below:
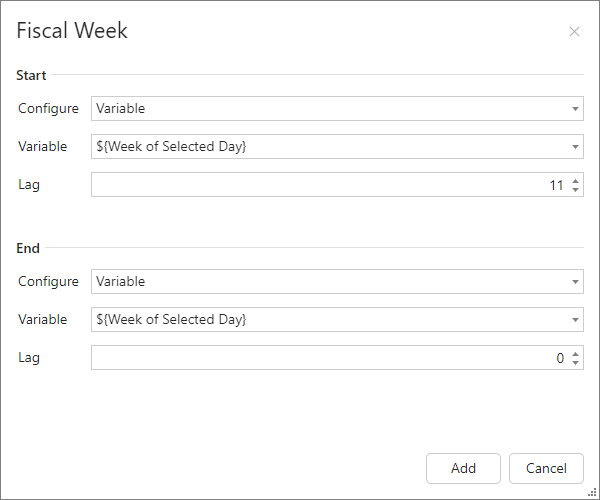
8. Select Add.
9. Configure the column and Filters as desired:
10. Create a chart and place it over the Form.
11. Follow the same steps to create the chart for last year. The only difference is to use:
${Week of Selected Day (Last Year)}
when defining the Fiscal Week hierarchy on the row.
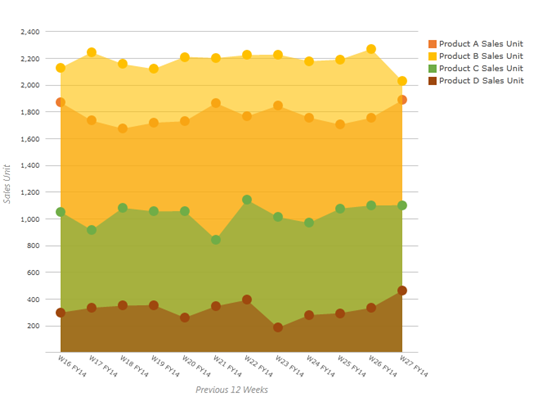
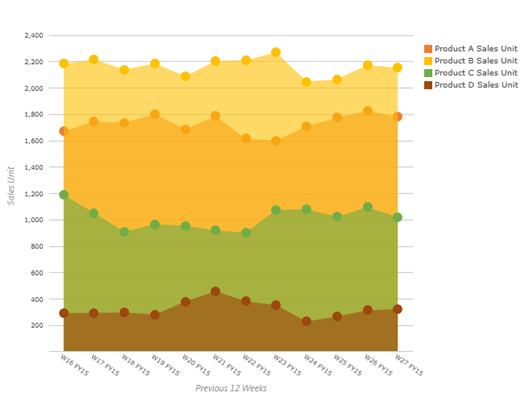
This is the chart you get: