
Introduction
In part 9 of the Modeler Tutorial, let's create two Data Rules (Calculate OPEX and Calculate Net Income) to calculate the values in the Reporting Model. Kepion's Data Rule Editor simplifies and expedites the process of writing business rules by eliminating the need to write your own SQL scripts.
Note: For more information on how to design Data Rules, please see Part IV of the Kepion Training Video Series.
Calculate OPEX
Let's create the first Data Rule for the Reporting Model. This Rule will transfer the values over from the Expense Model. If you don't recall, we manually entered these values on the Operating Expenses Form.
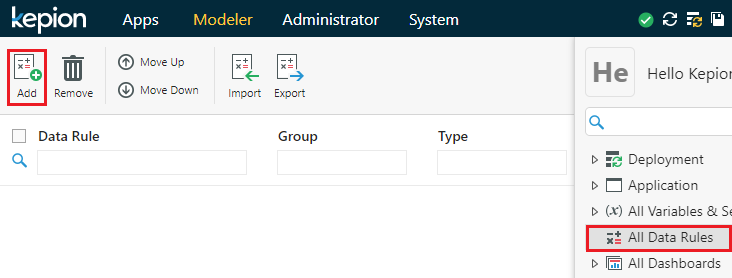
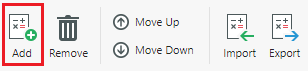
1. In the Modeler, navigate to the All Data Rules section and click Add.
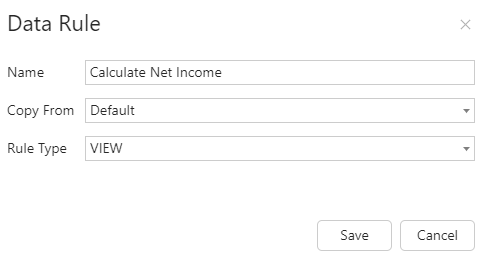
2. Name the Data Rule Calculate OPEX and ensure the type is set to VIEW.
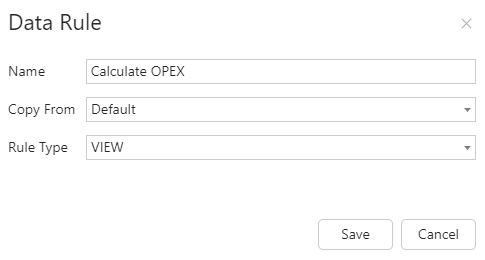
Tip: VIEW Rules generate SQL Views, which are virtual tables. Views are dynamic and update automatically as the data changes. ACTION Rules, on the other hand, are updated on demand and allow you to insert or delete the records in a partition.
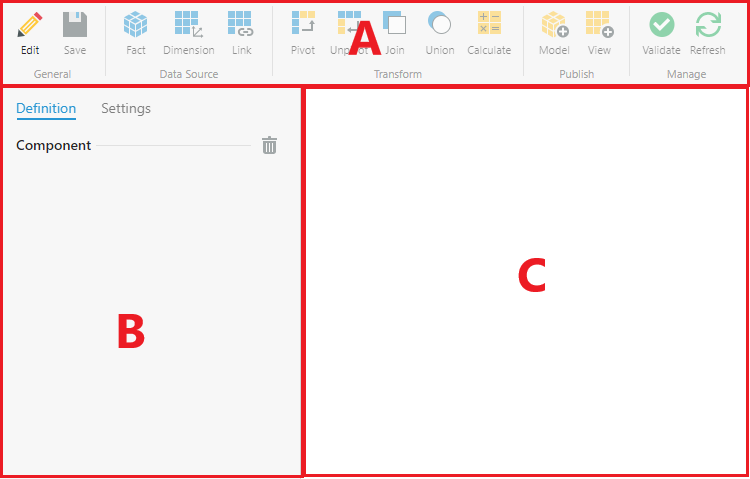
The Rule Editor should automatically open. It has a familiar interface as the Dashboard Editor.
A) All components you can use to move and manipulate data within the Rule
B) List of components used in the Rule
C) Selected component
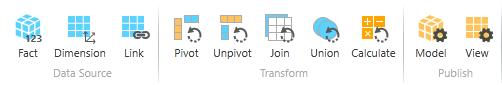
There are typically three steps to building a Data Rule. Selecting the Data Source, manipulating the data with Transform components, and then Publishing the results to a Model.
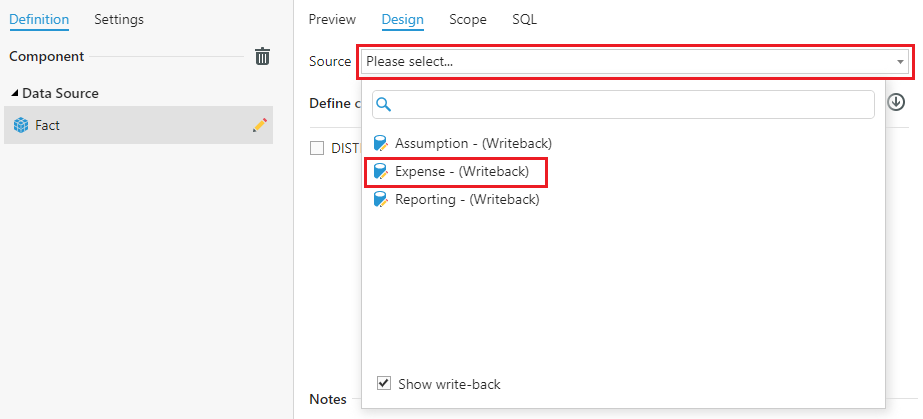
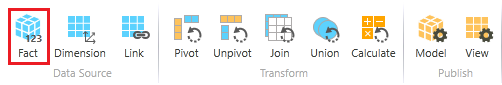
3. Select the Fact component. This brings in Fact Records from a selected Model Partition.

4. Select the Expense - (Writeback) partition from the Source drop-down.
You can verify the data by selecting Preview.
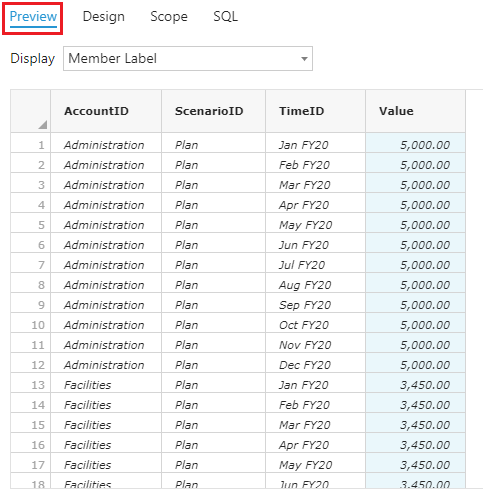
For this Rule, all we need to do is move these records to the Reporting Model— so we can skip the Transform components.
5. Select Model from the Publish section.
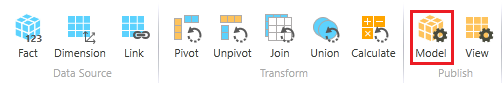
The Target is the Model we want to publish records to and the Source is the records we want to publish.
6. Select Expense - Writeback from the Source drop-down, and Reporting from the Target drop-down.
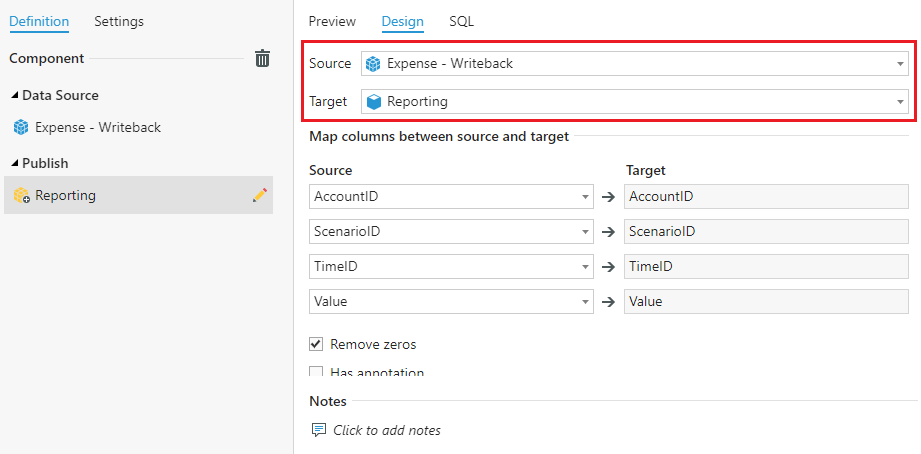
7. Select Save  .
.
Calculate Net Income
Now let's create the second Data Rule we need for the Reporting Model. This Data Rule will use the metrics we entered into the Assumption Model from our Assumptions Form. We'll then use those metrics to calculate Product Sales and Cost of Goods Sold.
[Product Sales] = [Quantity] * [Price]
[Cost of Goods Sold] = [Quantity] * [Cost]
1. Select Add.
2. Name the Rule Calculate Net Income and click Save.
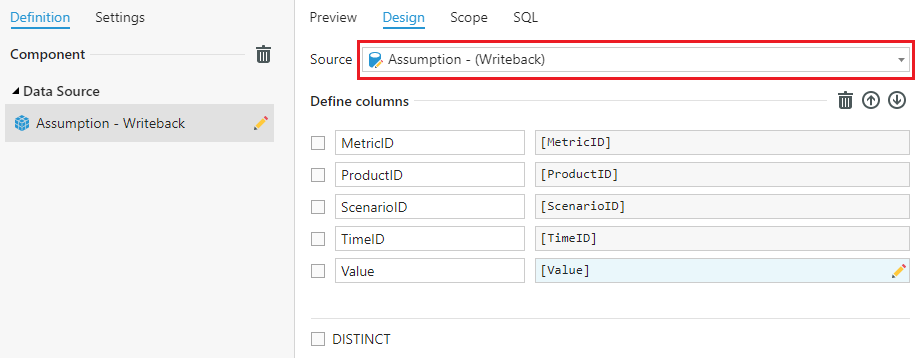
3. Select Fact.
4. Select Assumption - (Writeback) from the Source drop-down.
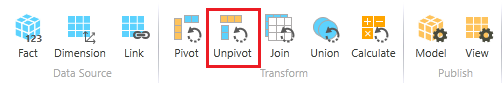
To multiply these values together, we'll need to utilize a few different Transform components. A brief explanation of each component is provided below. For a more detailed explanation of table calculations, refer to this video.
 |
Moves unique values from one column to multiple columns. |
 |
Perform Pivot's reverse operation. |
 |
Joins columns from one or more result sets together. |
 |
Joins rows from one or more result sets together. |
 |
Manipulate the columns of a result set. This step is useful when adding or removing columns to create the core rule logic. |
To perform this calculation, we need to move all three of these metrics onto the same row.
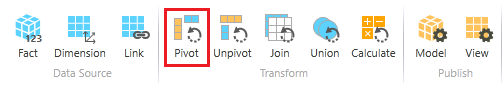
5. Select Pivot.
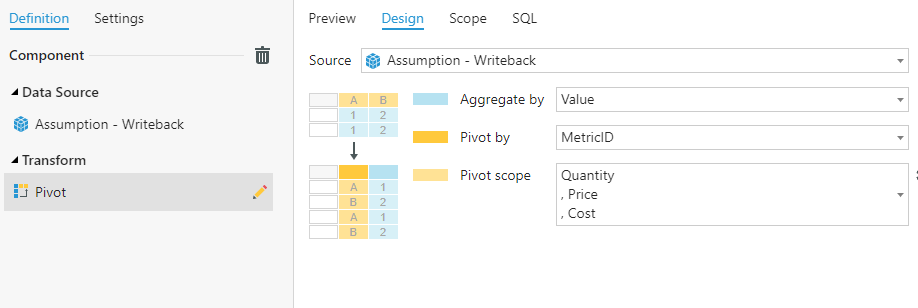
6. Configure the Pivot as follows:
Source: Assumption - Writeback
Aggregate by: Value
Pivot by: MetricID
Pivot scope: Quantity, Price, Cost
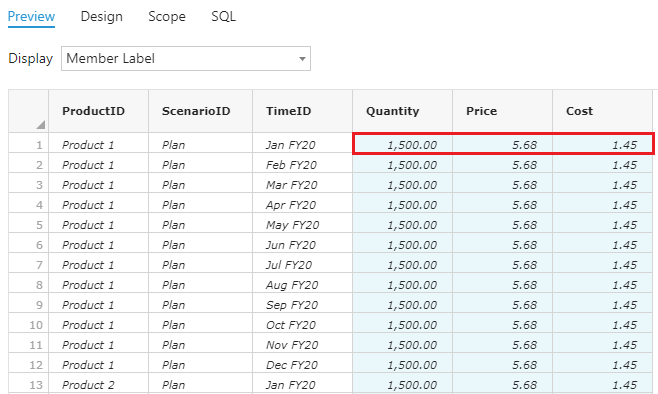
In the Preview tab, we can see that all three values are now lined up on the same row. Our tables are now set up to define the calculation.
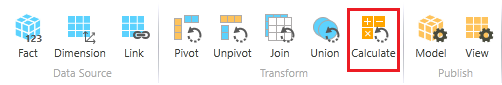
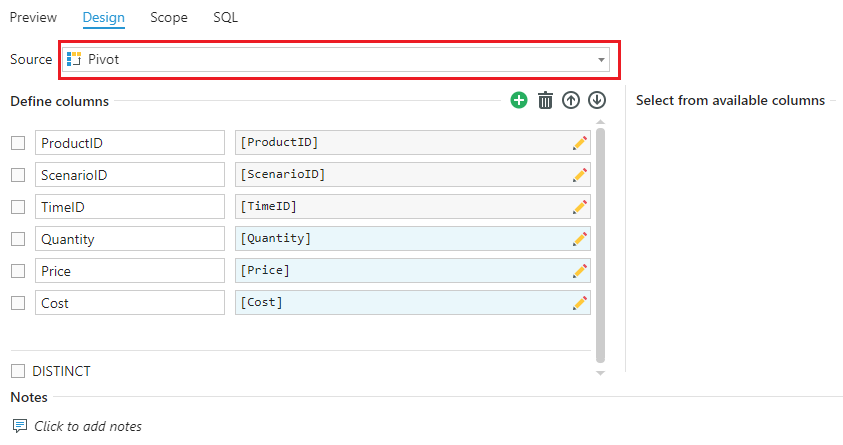
7. Select Calculate.
8. Select Pivot (the component we just configured) as the Source.
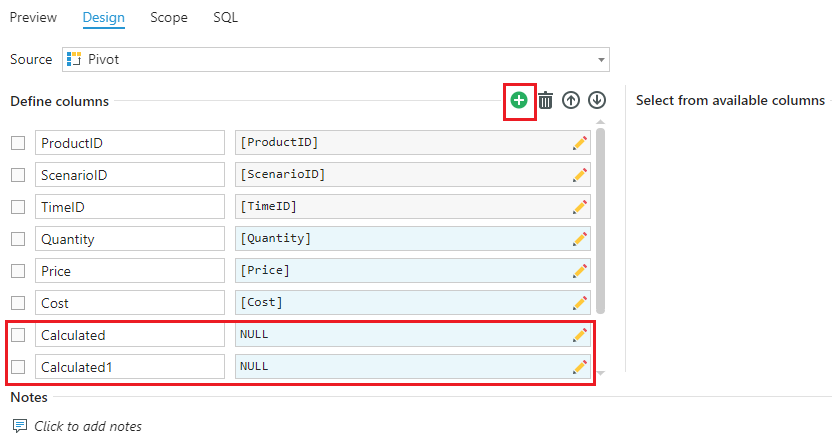
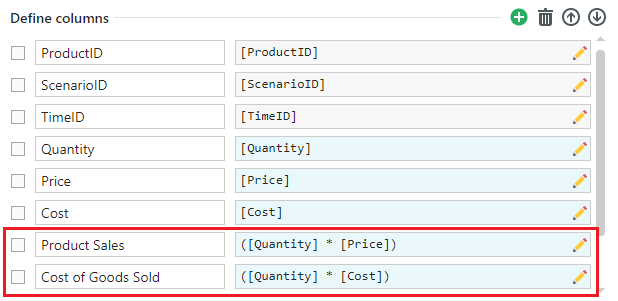
9. Select  to add columns. We need two to hold the results of the calculation.
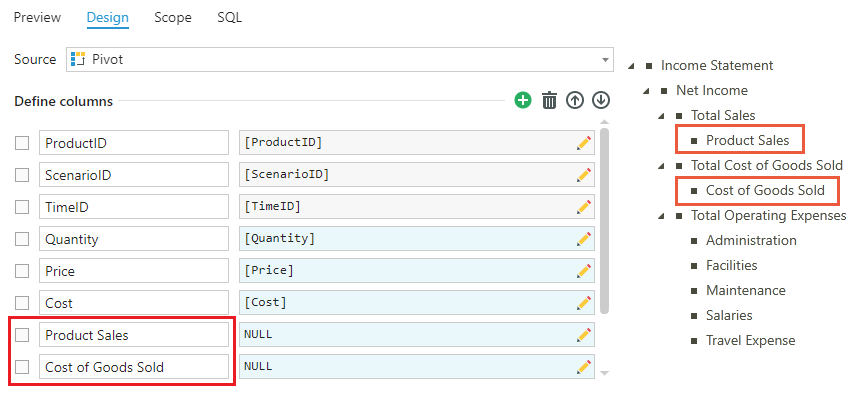
In order for the data to flow to the correct accounts, we need to name these columns the exact Member Label of the Accounts we're targeting.
10. Click the boxes in the left column to edit names. Call the first column Product Sales, and the second Cost of Goods Sold.
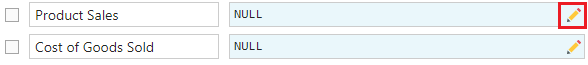
11. To configure the calculation, select  for the Product Sales column.
12. Define the calculation as follows:
[Quantity] * [Price]
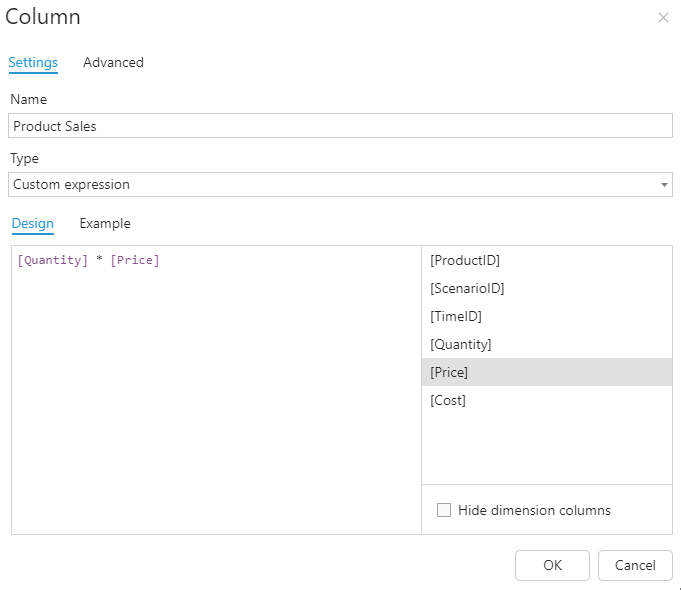
Tip: Instead of writing out the whole definition, you can double-click the column names on the right to bring them into the calculation.
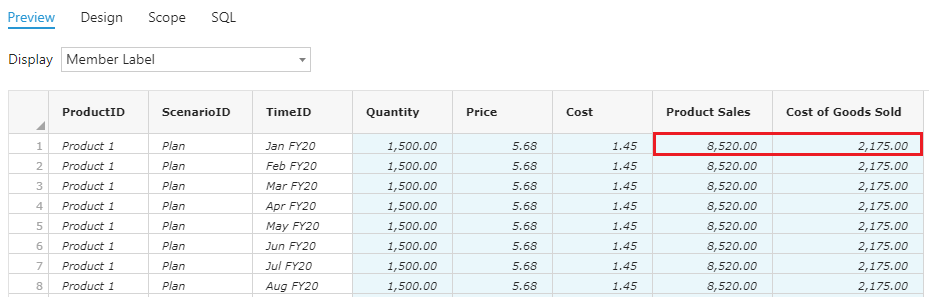
13. Define the other Cost of Goods Sold column as follows:
[Quantity] * [Cost]
You can check the Preview tab to make sure the calculation looks correct.
14. Remove the three metrics from the table as we don't need them in the Form.
Now that we have the correct data, we need to Unpivot the table back into the original format. This is so the table's structure matches the Model's structure (where the data will be published).
15. Select Unpivot.
16. For the Source, select Calculate, and then select both Accounts to unpivot.
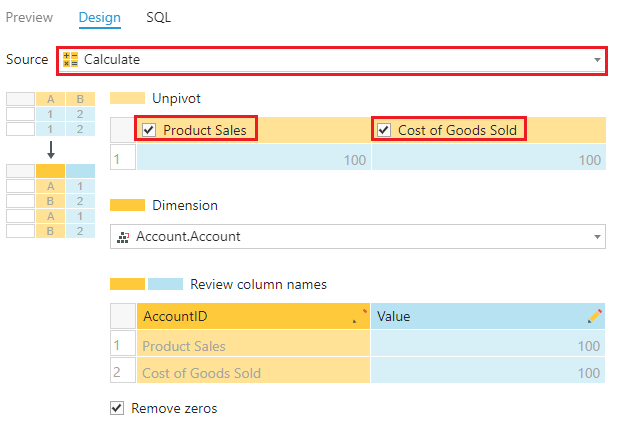
Note: If you receive a warning, double-check the column names in the Calculate step to make sure they exactly match the Dimension Member Labels.
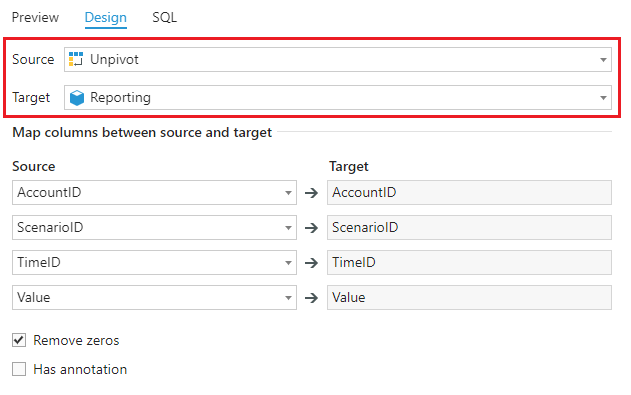
17. Select Model.
18. Select Unpivot as the Source, and Reporting as the Target.
19. Click to save the Data Rule.
Publish Data Rules
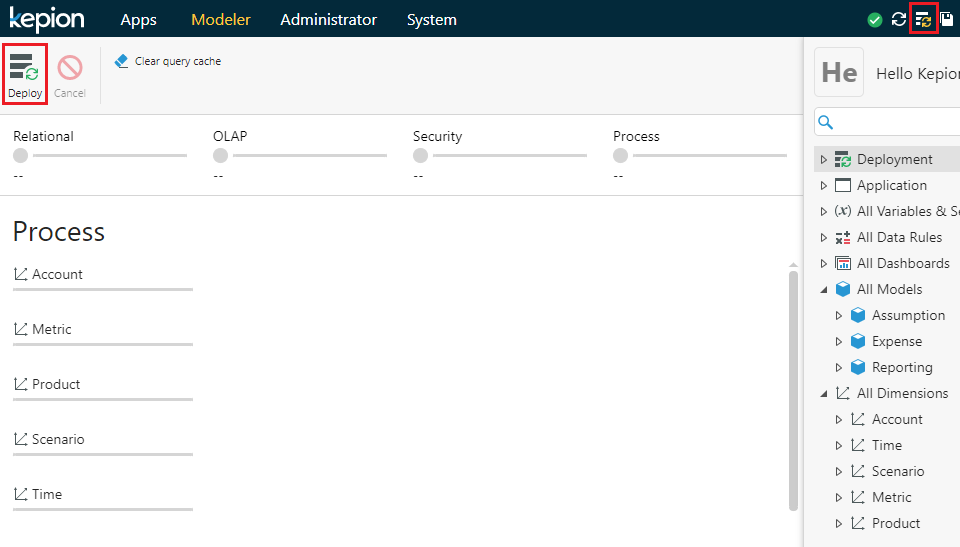
To ensure the Data Rules are in effect, we need to deploy the Application.
Go to Deployment and select Deploy. You can also click  in the navigation bar.
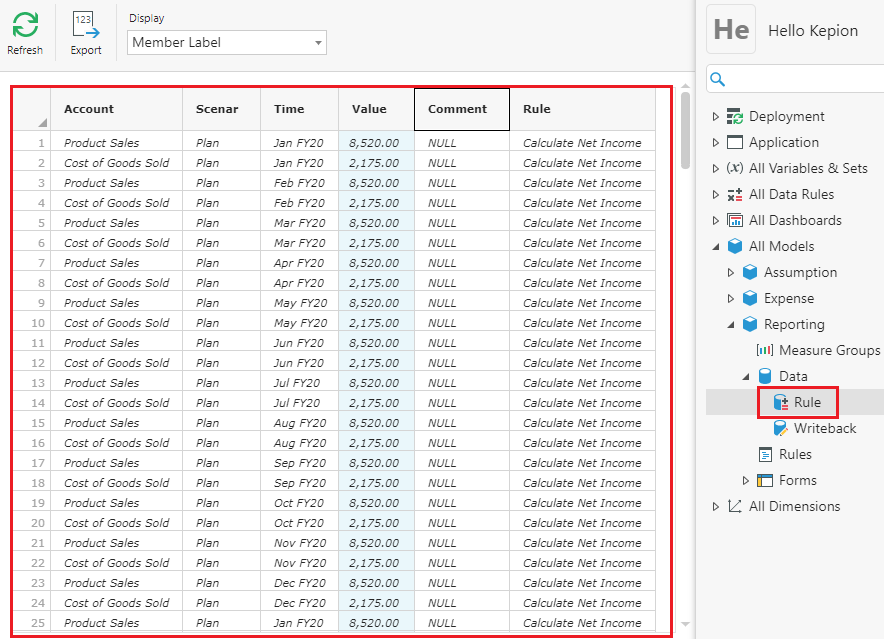
The data from VIEW Rules is always published in the Rule Partition of the target Model. Also note the Rule Column, which tells us which Data Rule is generating these records.
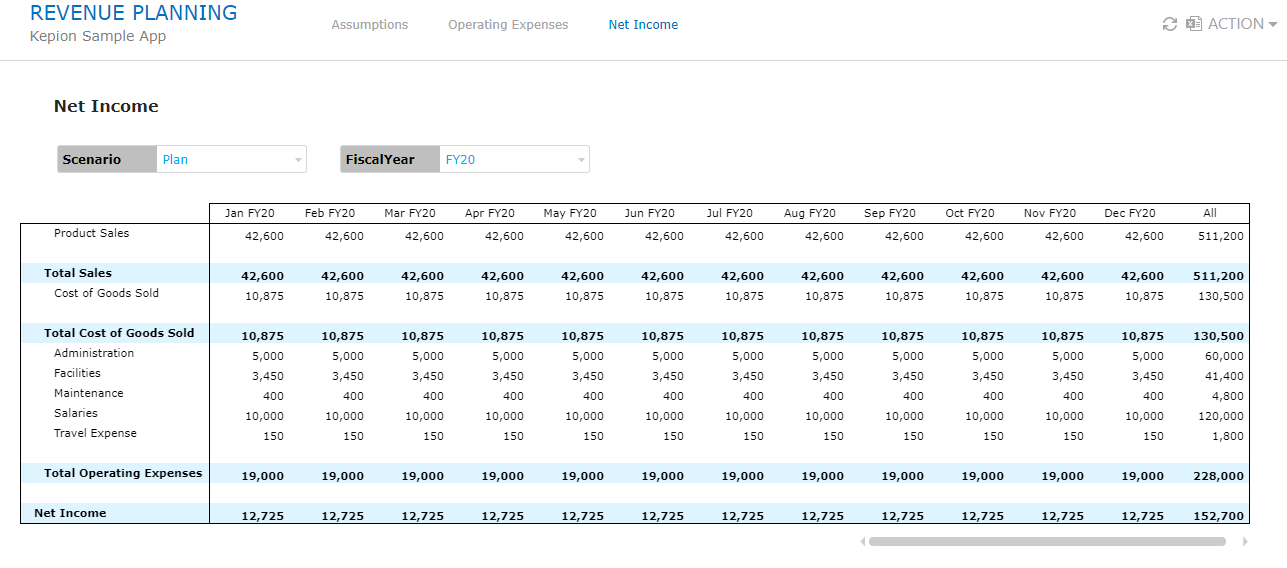
If we navigate back to our Dashboard App, the Net Income Report should now be complete. In addition, the aggregated totals have been automatically calculated.
Conclusion
Congratulations! You have just finished creating your first Kepion solution.
While this is just a simple example, imagine expanding this Application across an entire business with thousands of products, where each user or manager can contribute their own piece to the planning process in real time.
We recommend you try planning out different business scenarios, or changing the values in the input forms to see how they affect the Net Income Report. If you haven't already, it's strongly encouraged to watch the Kepion Training Video Series, which covers this entire process in much more depth.
If you have any questions about this content, check out the Knowledge Base to learn best practices and find documentation on all of Kepion's features. If your question isn't answered in the Knowledge Base, please submit a ticket.