Introduction
Kepion is a Corporate Performance Management (CPM) software platform, with the Modeler at its core. Providing a straight-forward interface and easy-to-configure components, Kepion's Modeler enables users to efficiently build robust CPM Applications.
These Applications, or solutions, promote collaboration across business areas and departments, promoting a unified approach to your planning, budgeting, and forecasting process. As data is collected in real-time, Applications provide an always up-to-date and accurate picture of your business.

The Modeler has the functionality to build both the Application's back-end infrastructure and front-end UX. As Applications are constructed from an underlying database leveraging Microsoft SQL technology, you can consolidate and secure all your data and logic in one single source.

Kepion has been used to craft Planning, Budgeting, Forecasting, and Workforce Management solutions for enterprise businesses on every continent, in every industry. Energizer, Unilever, Playtex, BHP, GE Capital, and Bayer Healthcare Pharmaceuticals have used Kepion to streamline their budgeting and forecasting process with real-time reporting and analysis.

Getting Started
In this tutorial, we'll cover the basics of the Modeler. You will learn about creating a new Application, defining Dimensions and Models, constructing Forms and Dashboards, and creating Data Rules to drive calculations. By the end we'll have a fully functioning sample Application.
Tip: A backup of this Application is attached below for reference.

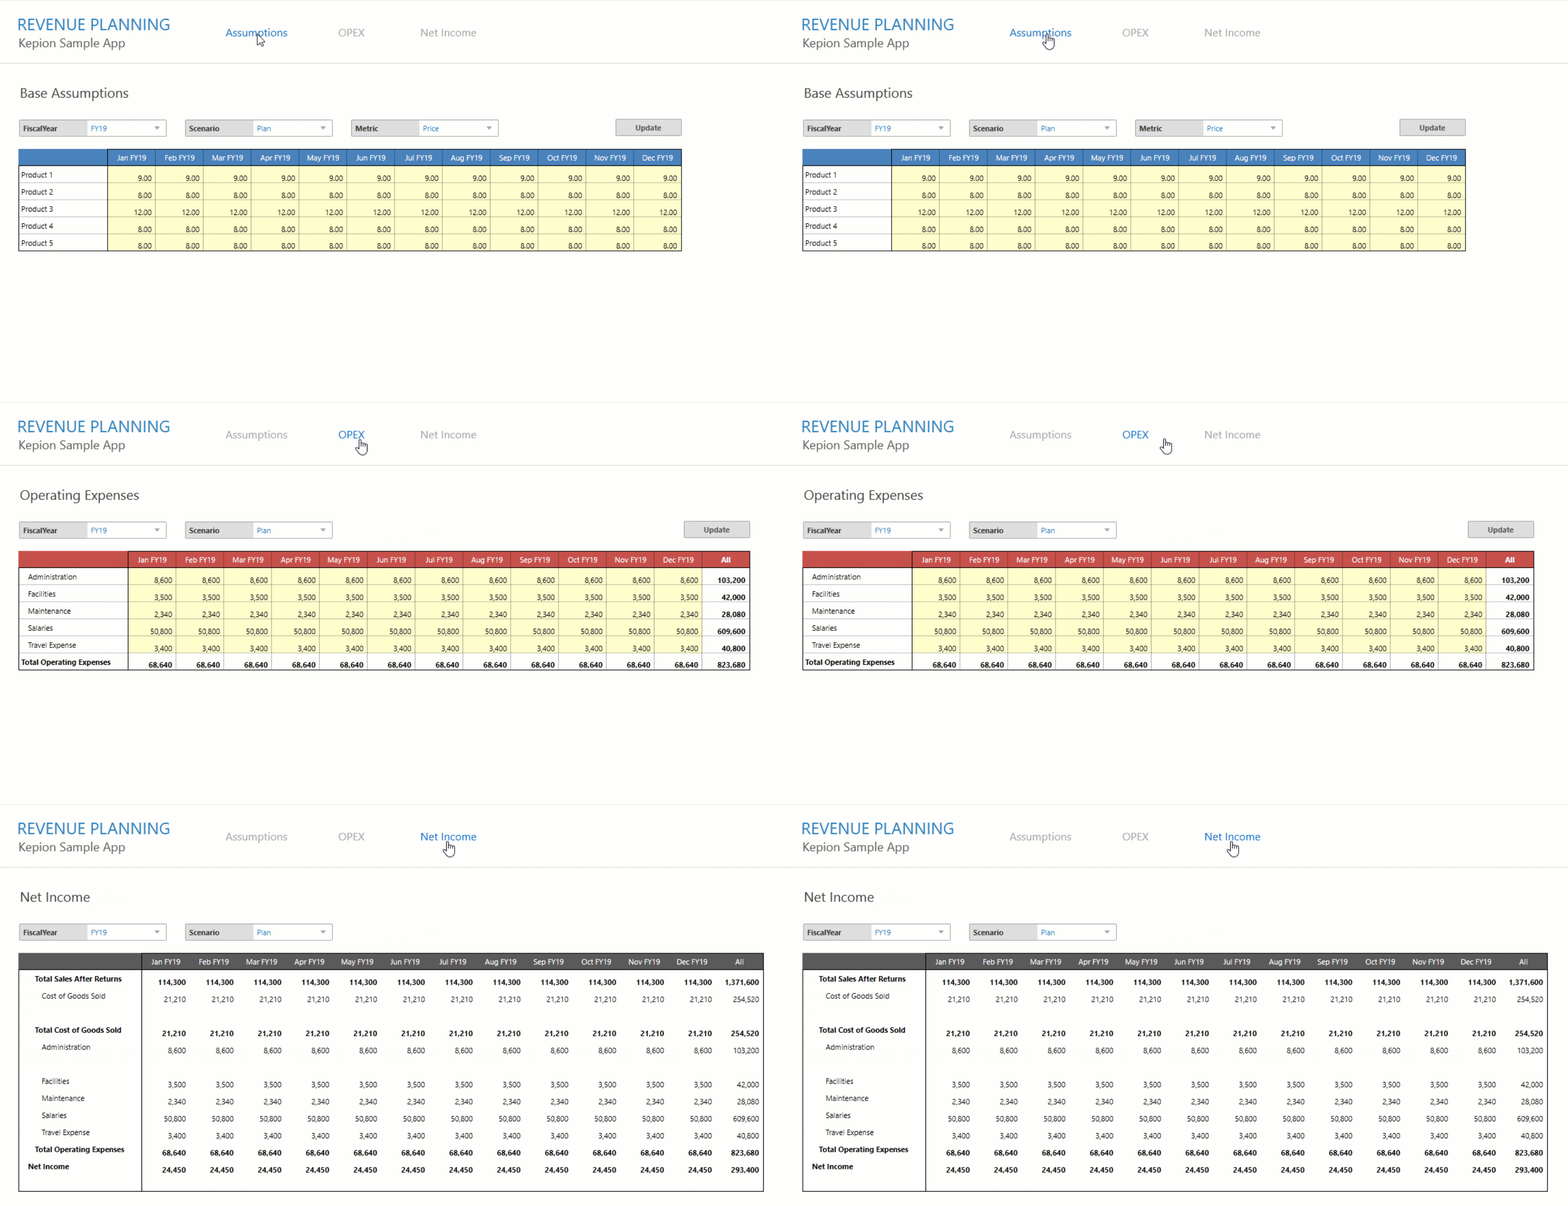
Our Application will contain a single Dashboard App, which you will design to track a fictional business's revenue and expenses. In short, the App will handle the cost of one product, its price, its sales, and some basic operating expenses. We will work with this data to plan for the future and estimate our bottom line.

In order to build this Application, we need to model five key data points, or Dimensions: Account, Time, Scenario, Product, and Metric.
![]()
These Dimensions will define three OLAP cubes, or Models: an Assumption Model, Expense Model, and Reporting Model.

We'll then use these Models to create a number of reports, or Forms. Forms allow us to interact with the data stored in the Models.

Lastly, we'll set up the calculations and business rules that define how the data should be presented in the Net Income Report. At the end of the tutorial, you should have a strong understanding of each of the basic components that drives a Kepion Application.
Select Part 1 - Application Settings from the Table of Contents below to start the tutorial.
Table of Contents
Part 1 - Application Settings - Setup the initial application and configure default settings.
Part 2 - Dimensions - Define and configure the five dimensions needed.
Part 3 - Models - Use the newly created Dimensions to define three Models.
Part 4 - Forms I - Learn the basics of Form design, and construct a simple input form.
Part 5 - Forms II - Learn more about Form design with two additional forms.
Part 6 - Dashboards - Build the interface for end-users to interact with the application.
Part 7 - Administrator Settings - Set permissions for writing data and create a Dashboard App.
Part 8 - Dashboard Apps - The basics of using a Dashboard App and entering data.
Part 9 - Data Rules - Build two Data Rules to calculate the Net Income Report.
